Evaluating Classification Models
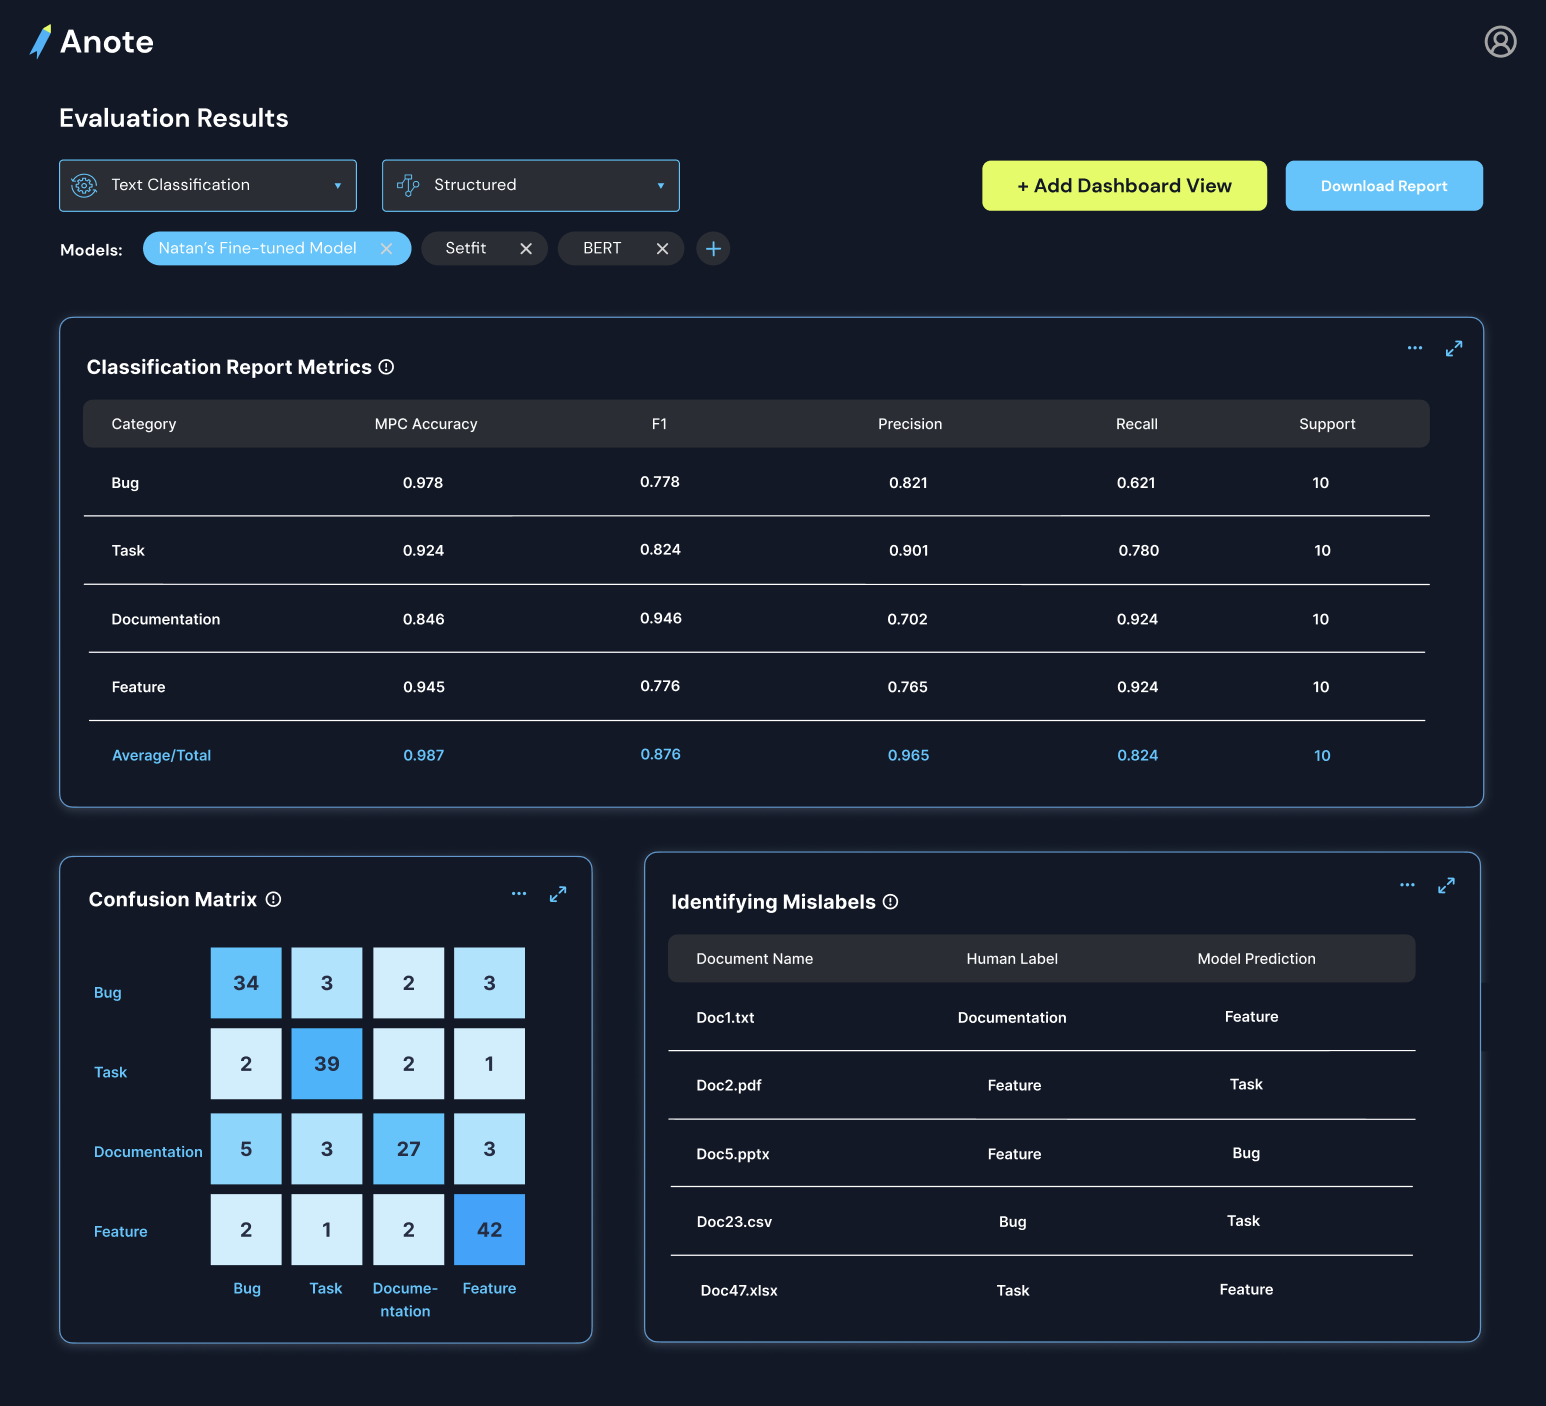
The Structured Dashboard provides an overview of model performance and the learning progress over time. It includes plots of accuracy, metrics from the sklearn's classification report, and a confusion matrix for class-specific predictions.
Example Cats vs Dogs Dataset
The Cats vs Dogs dataset is a collection of sentences describing experiences with cats and dogs, along with their corresponding labels indicating whether the sentence refers to a cat or a dog. This dataset is used for binary classification tasks in machine learning.
Dataset Overview
The dataset contains a total of 20 instances, with an equal distribution of 10 instances labeled as "cats" and 10 instances labeled as "dogs". Each instance consists of a text sentence and its associated label. Here are a few examples from the Cats vs Dogs dataset:
| Text | Label |
|---|---|
| I love playing with my cat. | cats |
| Dogs are so loyal and loving. | dogs |
| My cat always snuggles with me at night. | cats |
| I enjoy going for walks with my dog. | dogs |
| Cats are independent and mysterious. | cats |
| Playing fetch with my dog is so much fun. | dogs |
| My cat has the softest fur. | cats |
| Dogs are great companions. | dogs |
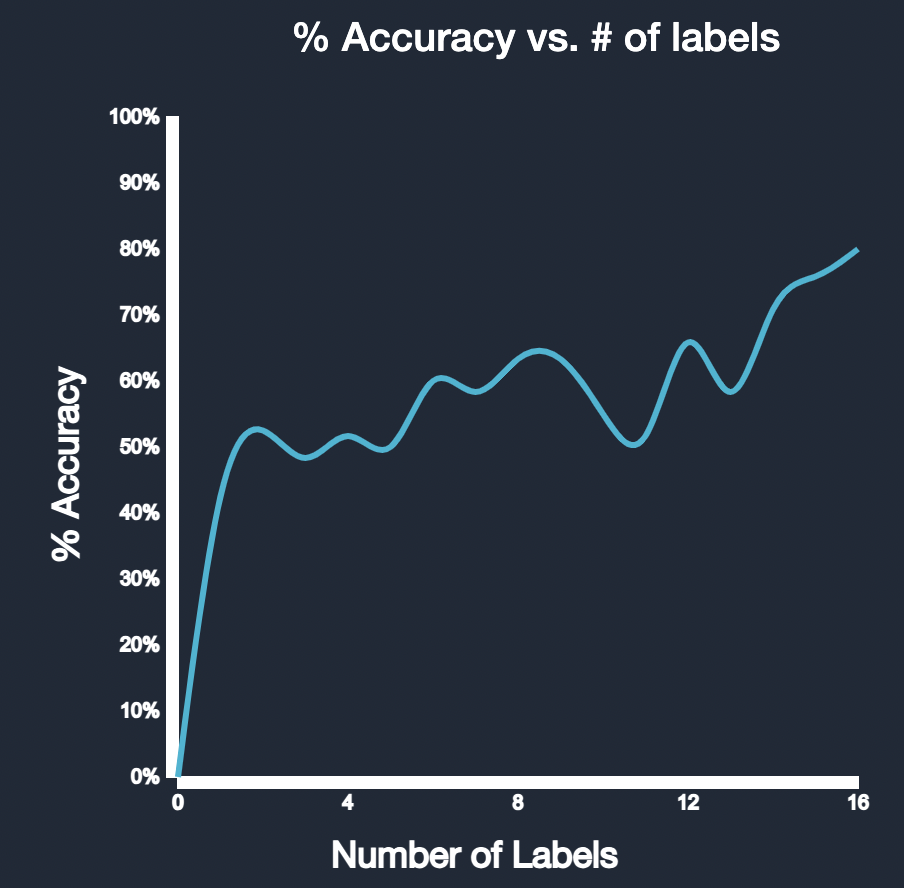
Accuracy Over Time
As the model continues to receive feedback and learn from it, the accuracy of predictions steadily increases. The accuracy plot reflects this improvement over time, demonstrating the model's ability to effectively incorporate feedback and adjust its predictions accordingly.
The following plot shows the accuracy of the model over time:
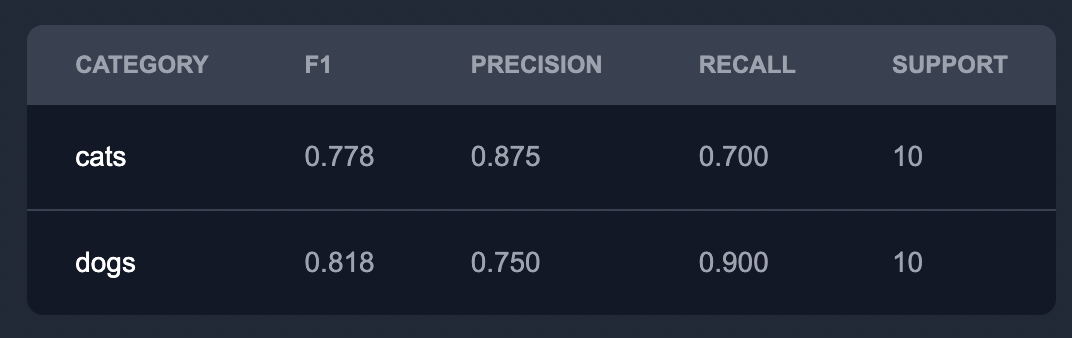
Metrics from Classification Report
The metrics from the sklearn's classification report provide detailed insights into the model's performance:
If we wanted to add a new category, say "Mouse", the model adjusts in realtime to provide specific metrics on the new category.
| Precision | Recall | F1-Score | Support | |
|---|---|---|---|---|
| Cat | 0.85 | 0.92 | 0.88 | 100 |
| Dog | 0.78 | 0.75 | 0.76 | 90 |
| Mouse | 0.92 | 0.89 | 0.91 | 110 |
| Avg / Total | 0.86 | 0.86 | 0.86 | 300 |
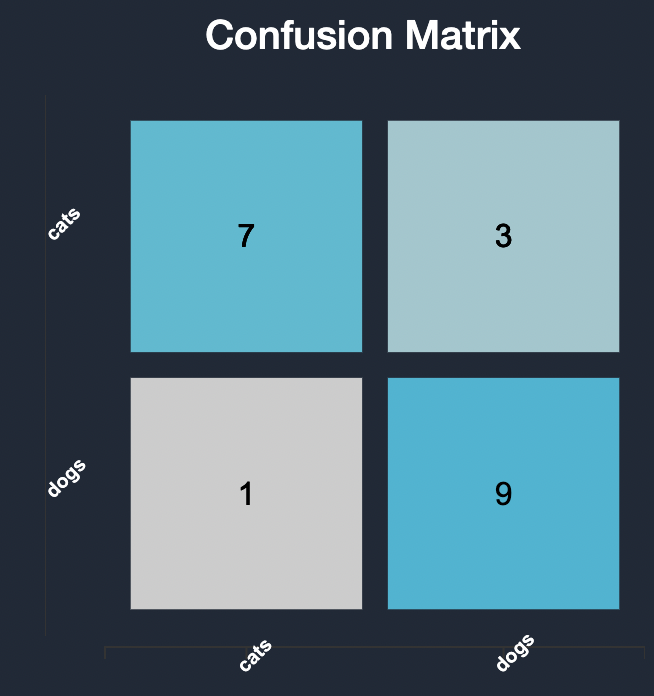
Confusion Matrix
The confusion matrix provides a visual representation of class-specific predictions:
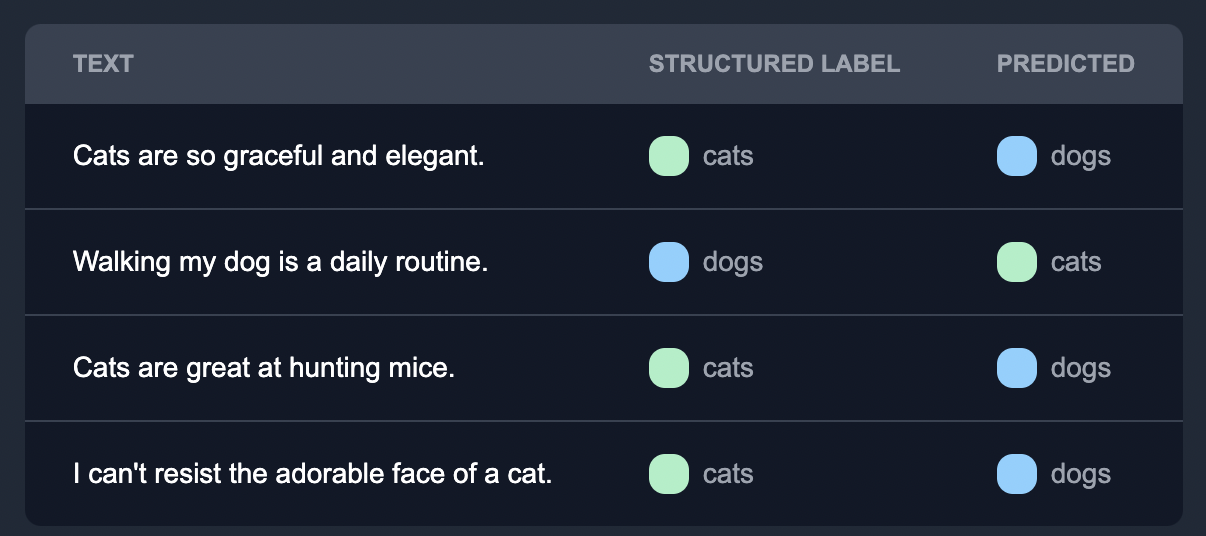
Identifying Mislabels
The model actively learns from feedback provided by human annotators over time. By incorporating this feedback into the training process, the model improves its performance and reduces mislabeling errors. This iterative learning process allows the model to adapt to different data patterns and enhance its accuracy and reliability.
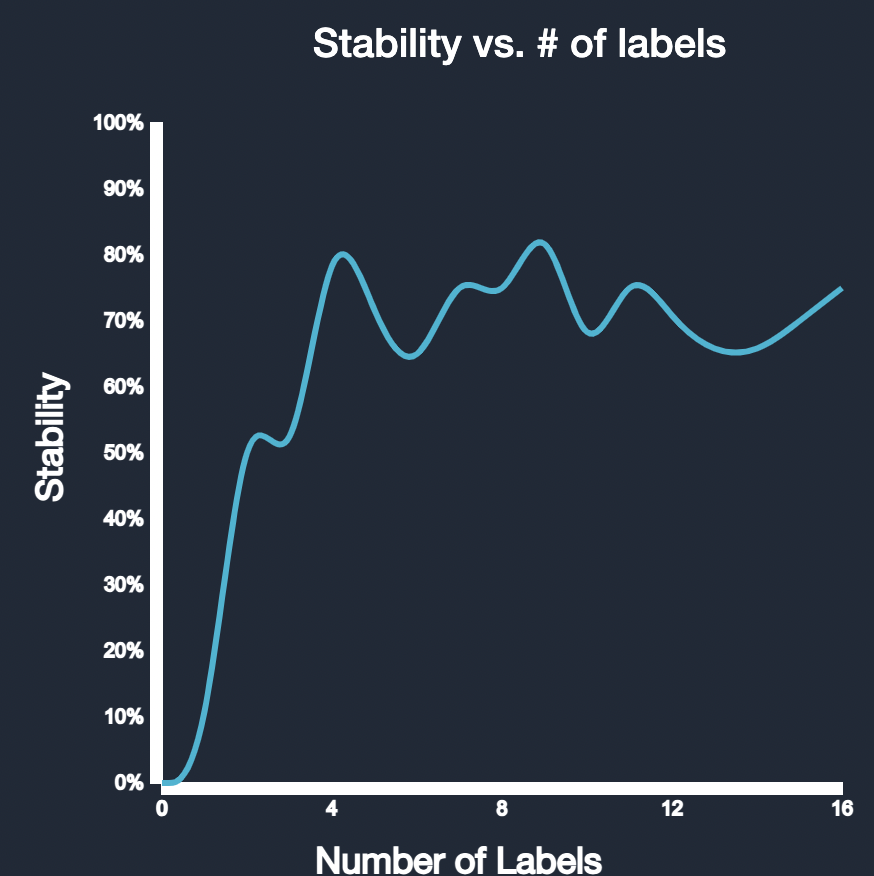
Stability Threshold
To evaluate how many labels are needed to ensure high quality results, we developed a stability metric that determines the difference in fluctuation over time as a function of labels. After reaching a certain stability threshold, the model's performance remains relatively consistent even with additional feedback. This indicates that the model has achieved a high level of accuracy and has minimized mislabels to a significant extent. At this stage, the model's predictions can be trusted with confidence, which we indicate to the user.
Conclusion
The Structured Dashboard provides valuable insights into the model's performance, learning progress, and the impact of human feedback. By actively learning from feedback and incorporating it into the model, we continuously enhance the accuracy and reliability of the predictions.