Annotator Metrics
Annotator metrics play a crucial role in assessing the performance and quality of annotators involved in data annotation tasks. When multiple annotators are engaged in the annotation process, it is essential to have a systematic approach to evaluate their individual performance. This section will discuss the significance of annotator metrics and describe various methods to assess annotator performance.
Importance of Annotator Metrics
In many annotation projects, multiple annotators are employed to annotate a large volume of data. However, it is common for annotators to exhibit variations in their interpretations and quality of annotations. Some annotators might provide accurate and consistent annotations, while others may struggle or introduce errors. Annotator metrics serve the purpose of objectively measuring and comparing the performance of annotators, allowing us to identify those who excel and those who need improvement.
By leveraging annotator metrics, we can:
-
Identify top-performing annotators: Annotator metrics enable us to recognize annotators who consistently deliver high-quality annotations. This information helps in selecting the most reliable annotators for future projects or assigning them to crucial annotation tasks.
-
Pinpoint annotator weaknesses: Annotator metrics also help in identifying annotators who might be struggling or producing subpar annotations. By pinpointing their weaknesses, appropriate training or support can be provided to enhance their performance and ensure high-quality annotations across the board.
-
Ensure annotation consistency: Comparing annotations across multiple annotators allows us to identify discrepancies and inconsistencies. By evaluating annotator metrics, we can take steps to improve annotation guidelines, provide clarifications, or resolve any discrepancies to ensure consistent and reliable annotations.
Evaluating Annotator Performance
To assess annotator performance, we can employ various metrics and visualization techniques. These metrics provide valuable insights into annotators' productivity and progress in the annotation task. Here's an example table illustrating the annotator performance metrics:
| Annotator Name | Annotator Email | Role | Labels Assigned | Labels Completed | Labels Remaining |
|---|---|---|---|---|---|
| John Smith | john.smith@example.com | Annotator | 500 | 400 | 100 |
| Jane Doe | jane.doe@example.com | Annotator | 600 | 550 | 50 |
| Alex Johnson | alex.johnson@example.com | Annotator | 700 | 650 | 50 |
In the table above, Labels Assigned represents the total number of labels assigned to each annotator. Labels Completed indicates the number of labels successfully annotated by each annotator, while Labels Remaining shows the number of labels still pending completion. By analyzing these metrics, we can identify annotators who consistently contribute to the annotation task and maintain progress towards completion.
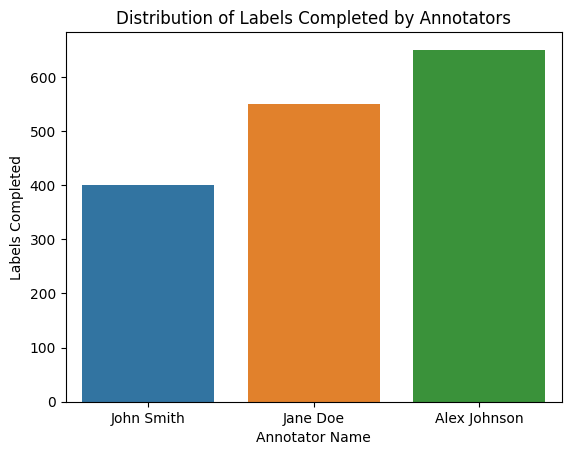
Bar Plot of Labels Completed
A bar plot can be created to visualize the distribution of labels completed by different annotators. This plot provides an overview of each annotator's labeling tendencies and can help identify any significant variations or biases among annotators.
Inner Annotator Agreement
Suppose we have a dataset with rows of data and three annotators: Annotator 1, Annotator 2, and Annotator 3. Each annotator has provided their annotations for the labels assigned to them. Here's an example of the data:
| Data | Annotator 1 | Annotator 2 | Annotator 3 |
|---|---|---|---|
| Sample 1 | Label A | Label B | Label B |
| Sample 2 | Label B | Label B | Label B |
| Sample 3 | Label A | Label A | Label A |
| ... |
One common challenge that occurs is that for rows of data where multiple annotators disagree on the labels, how can we best find the merged category, or the ground truth label for the given row. Currently, what many people do is discard rows of data where annotators disagree. This leads to around 25% of datasets being thrown away due to annotator disagreements, which is very harmful because these rows of data being discarded are oftentimes the edge cases that the model needs to improve it's performance.
Inner annotator agreement helps to solve this problem, by offereing a measure of the similarity between annotations produced by different annotators. This metric quantifies the level of agreement or disagreement among annotators for a given set of annotated data. One common approach to measure inner annotator agreement is through inter-rater reliability metrics like Cohen's kappa or Fleiss' kappa. We can use these metrics to generate an inter annotator agreement table, as can be seen below.
| Data | Annotator 1 | Annotator 2 | Annotator 3 |
|---|---|---|---|
| Annotator 1 | 1 | 0.85 | 0.78 |
| Annotator 2 | 0.85 | 1 | 0.80 |
| Annotator 3 | 0.78 | 0.80 | 1 |
This table represents an agreement matrix showing the agreement scores between three annotators (Annotator 1, Annotator 2, and Annotator 3) for the labeled data. The diagonal elements are all 1, indicating perfect agreement between an annotator and themselves, while the off-diagonal elements represent the agreement scores between annotators. We can use this table to understand which annotators are performing well, and which performing poorly, that way we can weigh better annotators higher when predicting the merged category.
Accuracy Assessment
Accuracy assessment involves comparing annotator annotations with ground truth or expert annotations. This can be achieved by selecting a sample of data annotated by multiple annotators and evaluating the agreement between their annotations and the reference annotations. By quantifying the accuracy of annotations, we can identify annotators who consistently produce correct and reliable annotations.
Here's an example table illustrating the inner annotator agreement and accuracy assessment:
| Annotator Pair | Agreement Score | Accuracy Score |
|---|---|---|
| Annotator 1 vs Annotator 2 | 0.85 | 0.92 |
| Annotator 1 vs Annotator 3 | 0.78 | 0.87 |
| Annotator 2 vs Annotator 3 | 0.80 | 0.89 |
In the table above, the "Agreement Score" represents the degree of agreement between annotators using a specific measure, such as Cohen's kappa or Fleiss' kappa. A higher agreement score indicates a higher level of consistency among annotators. The "Accuracy Score" measures the accuracy of annotators' annotations compared to the ground truth or expert annotations. A higher accuracy score indicates more accurate and reliable annotations.
Summary
Annotator metrics play a vital role in evaluating the performance and quality of annotators in data annotation tasks. By measuring the number of labels assigned, labels made, and labels remaining for each annotator, we gain insights into their productivity and contribution. Additionally, the inner annotator agreement and accuracy assessment allow us to assess the consistency, reliability, and accuracy of annotations, enabling us to identify top-performing annotators and areas for improvement. These annotator metrics provide valuable information to ensure annotation quality and enhance the overall effectiveness of the annotation process.